Social determinants of Health. SDoH is a really big deal. A growing body of evidence shows that individual health outcomes are closely tied to social circumstances, like living in a poor neighborhood (just google it). In some sense, it’s not a huge surprise that poor people don’t live as long as wealthy folk, but we’re seeing very different mortality rates by zip codes and it’s looking ugly.
How to pay for SDoH programs? Health systems across the country are rolling out new programs designed to address the social determinants of health. But for many systems there isn’t a clear, sustainable payment mechanism to provide patients with ongoing support services. As it stands, the rationale behind providing such support (transportation, housing, food assistance, etc.) is that patients’ health will improve, and their cost of care will reduce across time. This idea falls squarely into value-based care, which aims to compensate healthcare providers based on their patients’ health outcomes, rather than the number of services they perform.
The potential future savings might justify the upfront expenses of social service support, and this points to tricky ROI problems. Since most healthcare systems have little experience deploying social service support, it’s going to be easy to waste money on approaches that do not work. This is where data scientists can help build and share predictive models to address the many unknowns around SDoH programs.
Modeling SDoH interventions. Here is a generic population model that estimates the long term benefits (if any) from onne SDoH intervention. The exact intervention should not really matter, though I can’t be certain of that. I designed the model to help make ROI assessments, but it’s also useful for studying the dynamics of social service needs in a patient population. I review the modeling assumptions below, and how to use data to set the parameters.
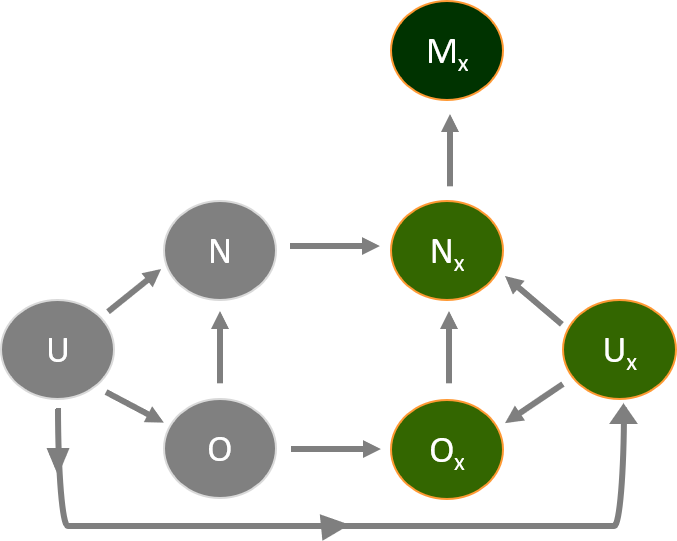
The model is defined by 8 states (buckets for different patient types). The ‘U’ states represent unscreened patients who may have social service needs that you’re not aware of. The ‘O’ states are patients who have been screened and do not present a clear need for social support. The ‘N’ states are patients who have been screened and have a clear social support need. The ‘M’ states are patients whose needs have been met (satisfied). And the subscript ‘x’ reflects patients with a health problem, such as one or more chronic diseases. All patients experience mortality. We pay particular attention to ‘Mx’ because most interventions will likely target this group for services and support.
Model Diagram

Use Case. As an example, consider an intervention to provide ride-shares to chronically ill patients who need the service. The key goal of the intervention is to reduce acute care spending among chronically ill patients. At the start of the modeling, time is at zero and all patients are unscreened. The movement of patients between states (transitions) is tracked, and these transitions can be estimated from medical claims, and from screening data collected during the early stages of the intervention. For example, after identifying a group of patients without a transportation need, you can calculate the onset of chronic disease (O -> Ox) in this group by doing a 1-year lookback in medical claims, and taking the proportion of patients who did not have a chronic condition one year ago, but now have a chronic condition. You would then scale that proportion according to the time step in your model simulations (translate annual rate to months, weeks, days, etc).
We can make a few defensible assumptions to help us interpret this model, and study only plausible scenarios. The first assumption is that patients with chronic conditions have higher healthcare costs compared to patients who do not have chronic conditions. The second assumption is patients with chronic conditions are more likely to die than patients without chronic conditions. And the last assumption points to average acute care spending for chronically ill patients – those patients who receive rides have: (1) spending that is greater than, or equal to, chronically ill patients who screened negative for a transportation need; and (2) have spending that is less than, or equal to, chronically ill patients who screened positive for a transportation need but did not receive rides. Here’s what this looks like in modeling terms:

This last assumption isn’t perfect, because patients who receive rides may have other unmet needs, or hidden attributes, that lead to greater acute care spending over time. But it should hold true if there’s no bias in the distribution of rides among chronically ill patients who need transportation support. And importantly, it allows us to predict the future interval between the best case scenario (Mx acute spend = Ox acute spend) and the worst case scenario (Mx acute spend = Nx acute spend) – and you can measure the value of this interval (potential savings) against your upfront investment in the intervention (the cost of rides).
And here’s what a 5-year simulation of acute care spending looks like when starting with 10,000 unscreened patients. As you can see, the potential savings in acute care spending grows across time.

As with all modeling efforts, the devil is in the details. I’m more than happy to provide extra details on this model, or even code if anyone wants it. Feel free to reach out whenever.
Happy readings!
~ James


